The Hydrosphere
and
Socioeconomics
in Modern Asia
Grant-in-Aid for Scientific Research(S):
The Hydrosphere and Socioeconomics in Modern Asia - Exploring a New Regional History Using a Database and Spatial Analysis
Gallery
Visualization of historical data with spatial ID can illuminate linkages with localities and relationships between natural environments and socioeconomics. The maps featured in this section represent our experiments of spatiotemporal visualization to present new historical hypotheses and examine them.
- Home
- Gallery
Michihiro Ogawa and Seemanta Sharma Bhagabati
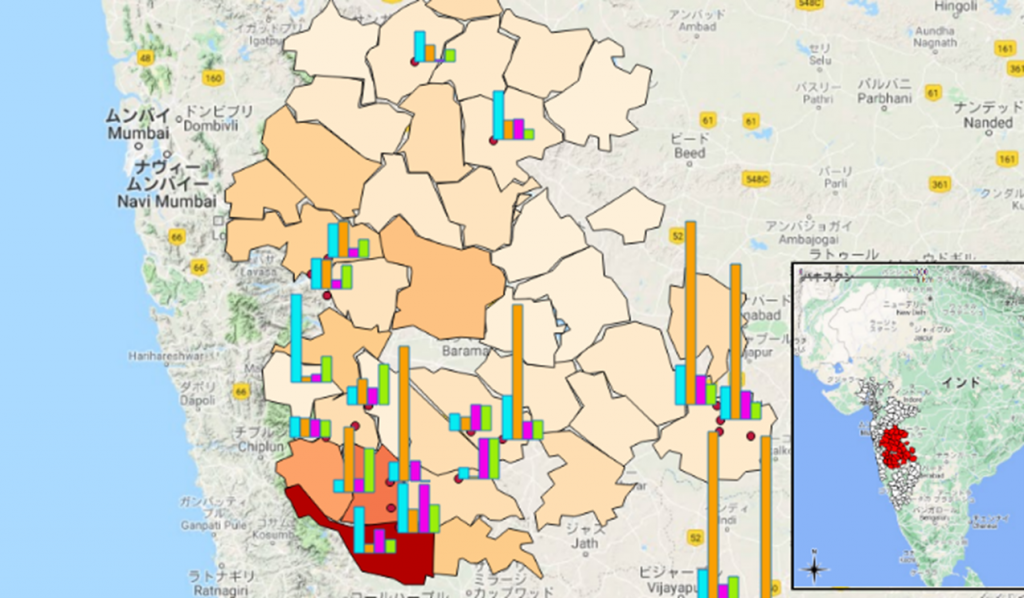
Number of cholera deaths in 1877 and the ratio of rainfall in 1877 to the average rainfall before the Great Famine
Michihiro Ogawa and Seemanta Sharma Bhagabati
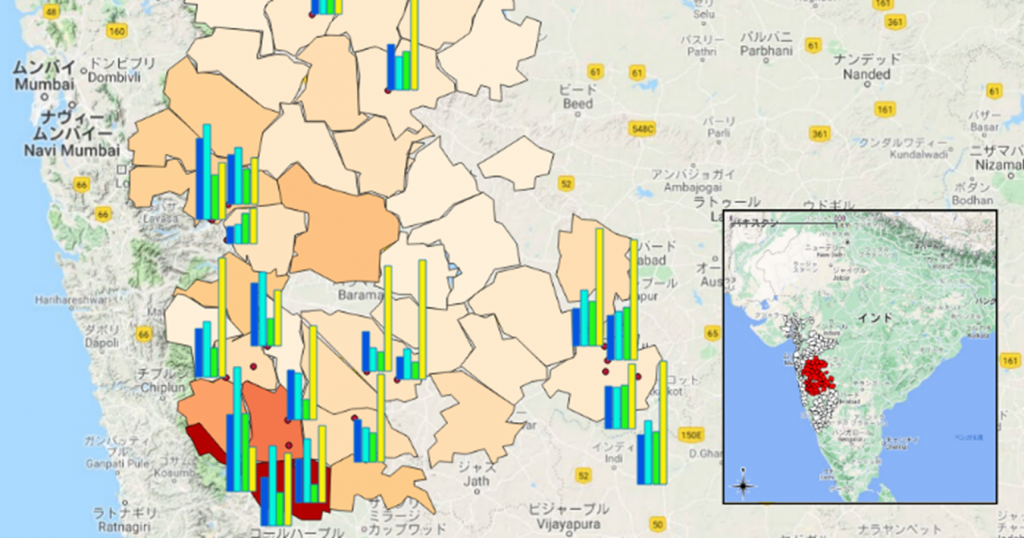
Number of cholera deaths in 1877 and average monthly rainfall for 1855-75
Michihiro Ogawa and Seemanta Sharma Bhagabati
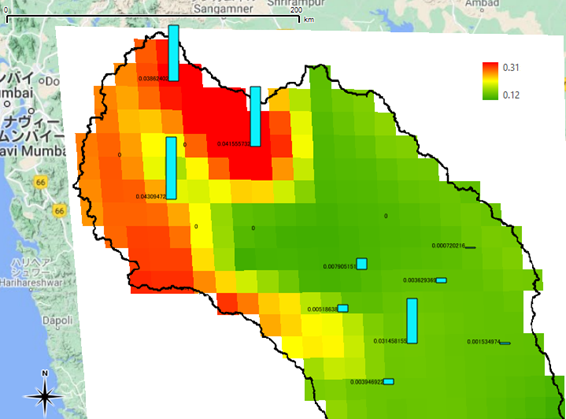
Soil moisture in the Bhima River Basin in August 1876 and the expected volume of winter crop compared to the previous year
Michihiro Ogawa and Seemanta Sharma Bhagabati
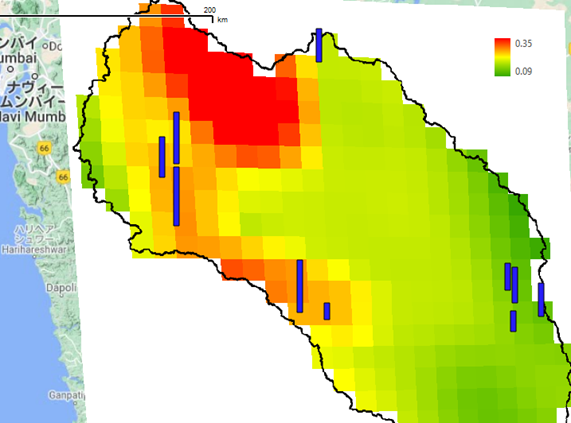
Soil moisture and rainfall in the Bhima River Basin in June 1876
Atsushi Ota
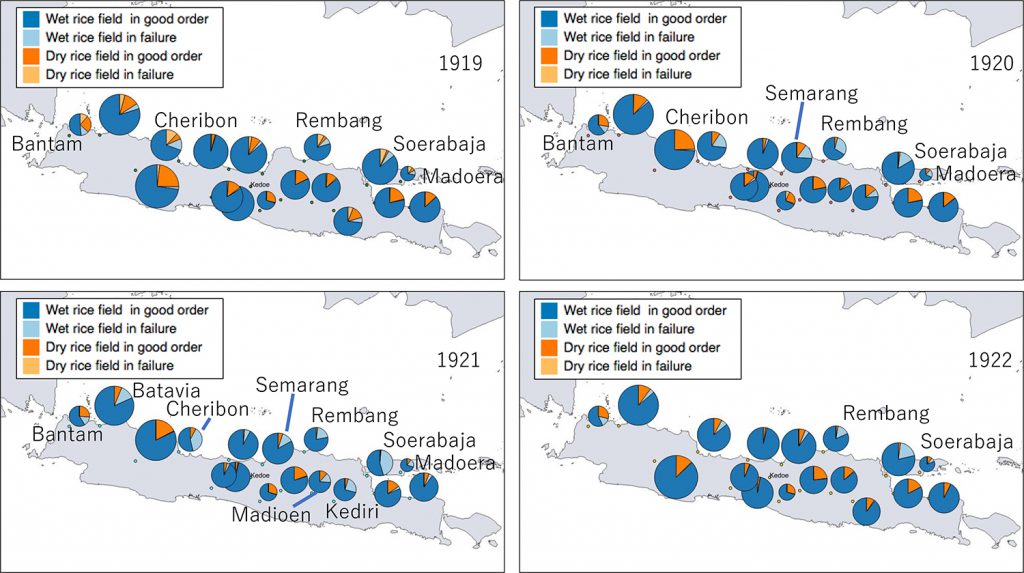
Rice production in Java and Madura, 1919-22
Yoshinori Kigoshi
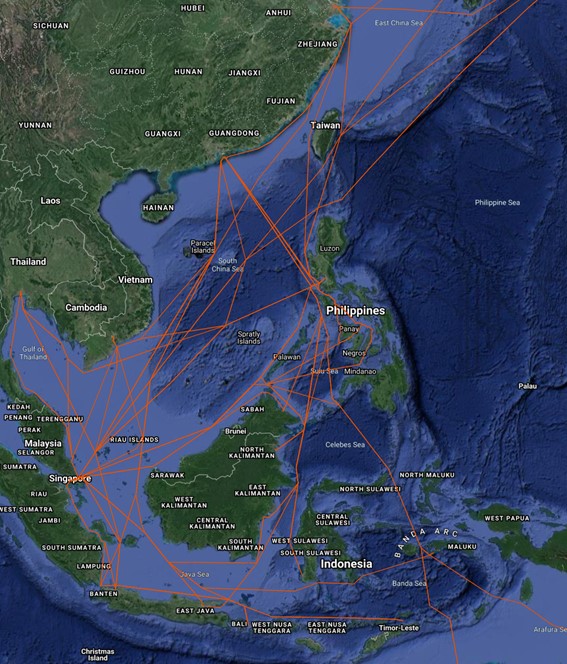
Visualization and Analysis of Shipping Intelligence 1:The navigation route of steamships in Southeast Asia
Yoshinori Kigoshi
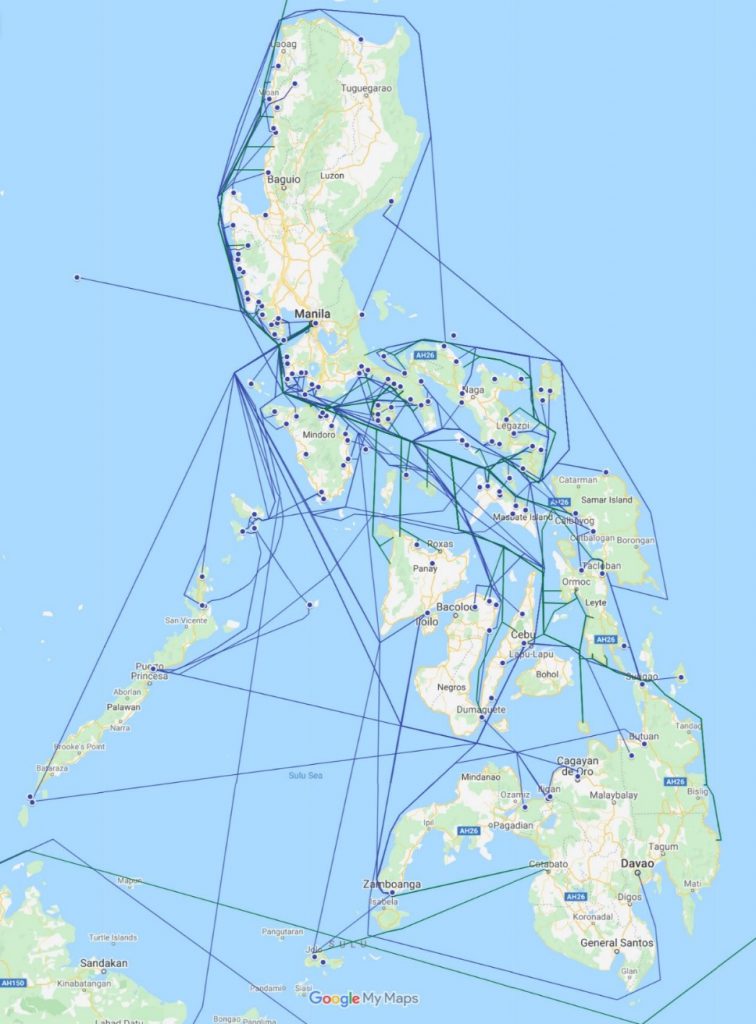
Visualization and Analysis of Shipping Intelligence 2:The network of steamships at the Philippines in 1913
Yoshinori Kigoshi
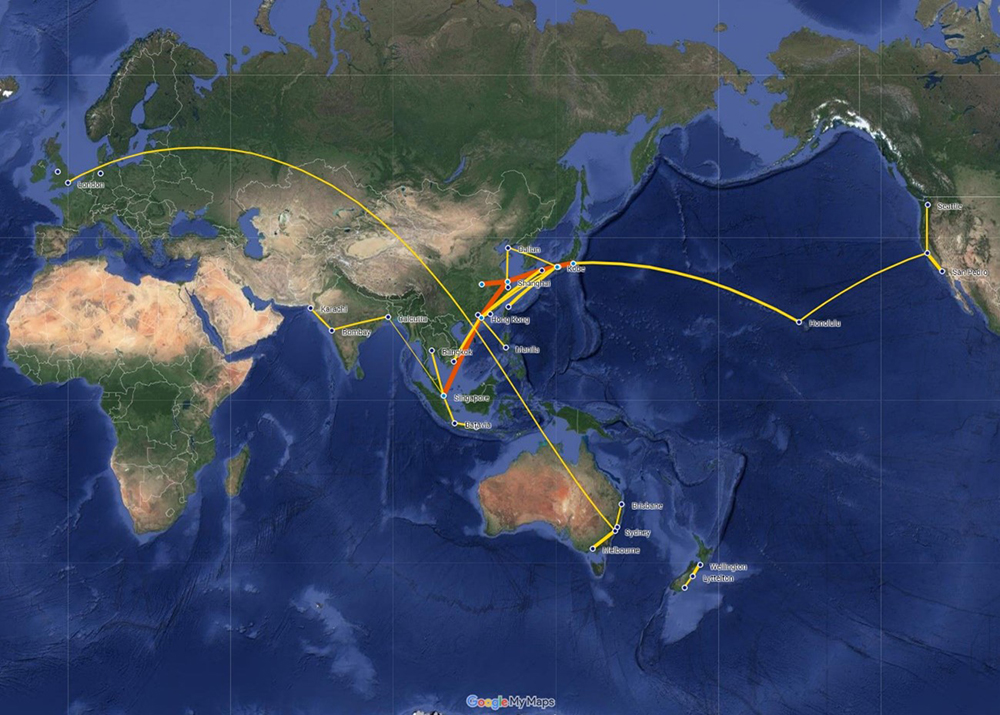
Visualization and Analysis of Shipping Intelligence 3:Cargo volume of steamships in the Asia-Pacific for the year 1913
Chang Liu and Tomoko Shiroyama
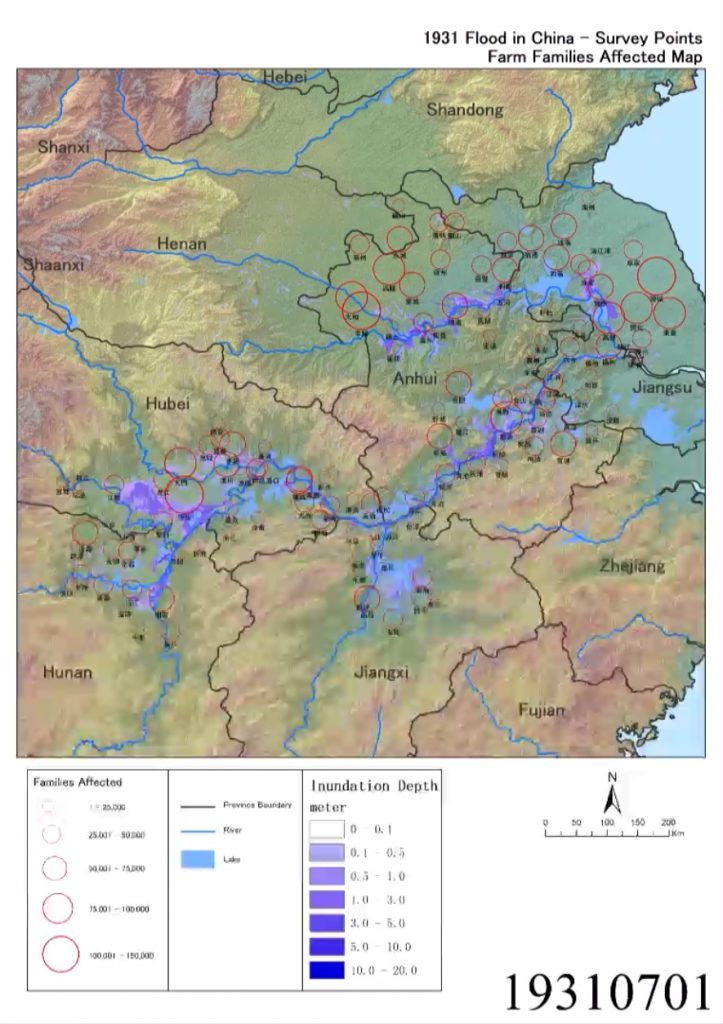
The 1931 Yangzi Flood: Flooding and the Number of Affected Families
Chang Liu and Tomoko Shiroyama
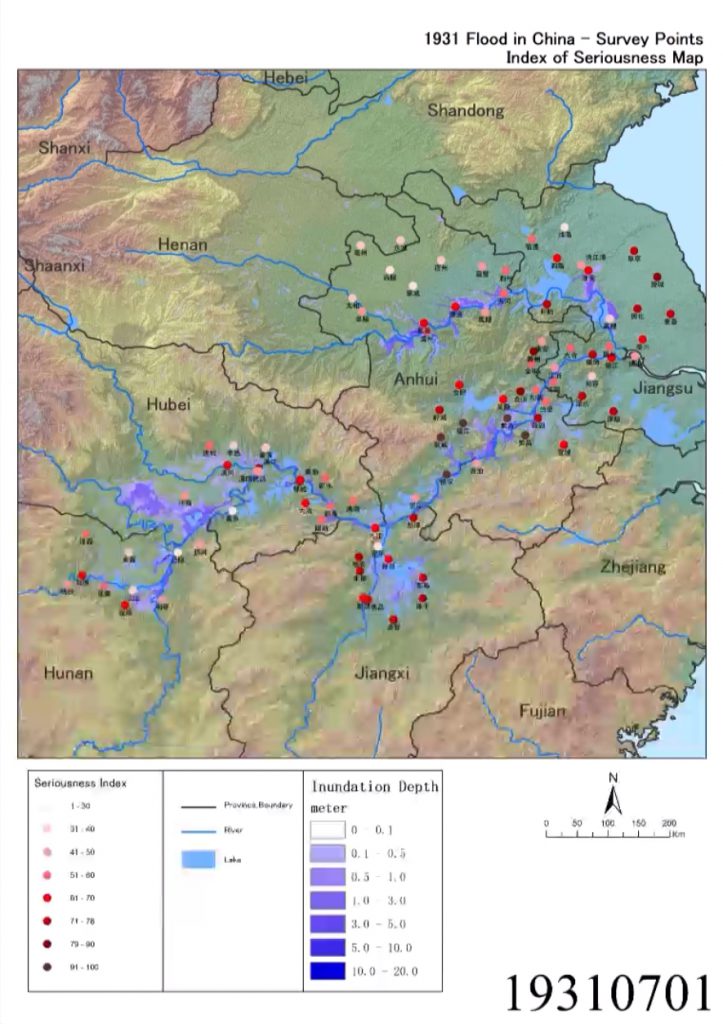
The 1931 Yangzi Flood: Flooding and the Index Number of Seriousness
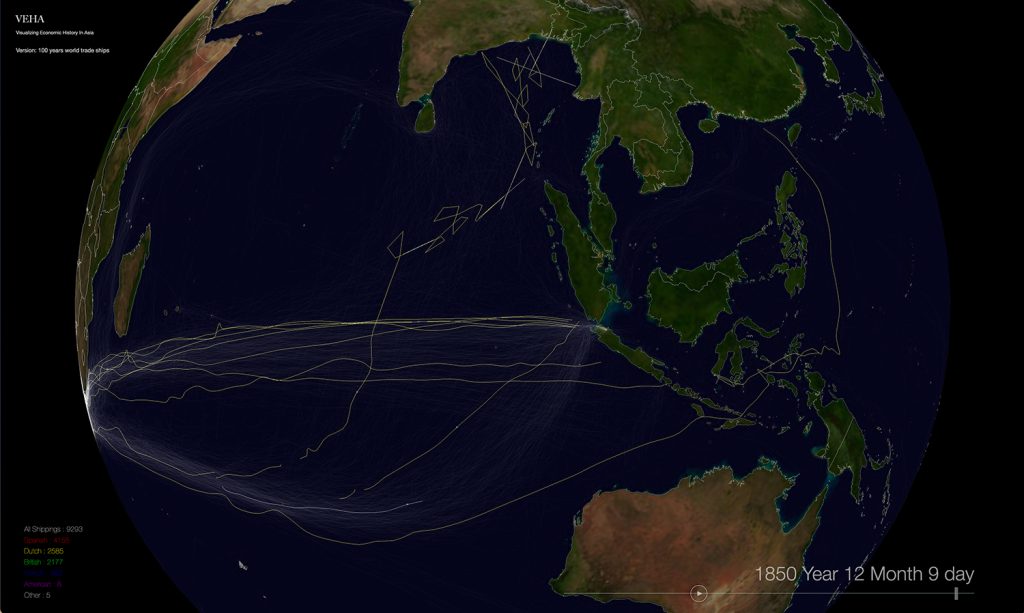
Visualizing Economic History in Asia (VEHA)

